
 Derek Bruff, Director, Center for Teaching, Vanderbilt University
Originally published on: February 15, 2012
This third newsletter on the theme of “Visual thinking in the classroom” was specifically written for us by Dr Derek Bruff, Director of the Center for Teaching, Vanderbilt University. Dr Bruff is the author of Teaching with Classroom Response Systems: Creating Active Learning Environments (Jossey-Bass, 2009). Make sure to visit his blog (http://derekbruff.org/) for some very creative ideas about using technology for teaching and learning. Of course CLT is available to support you should you want to explore any innovative ideas.
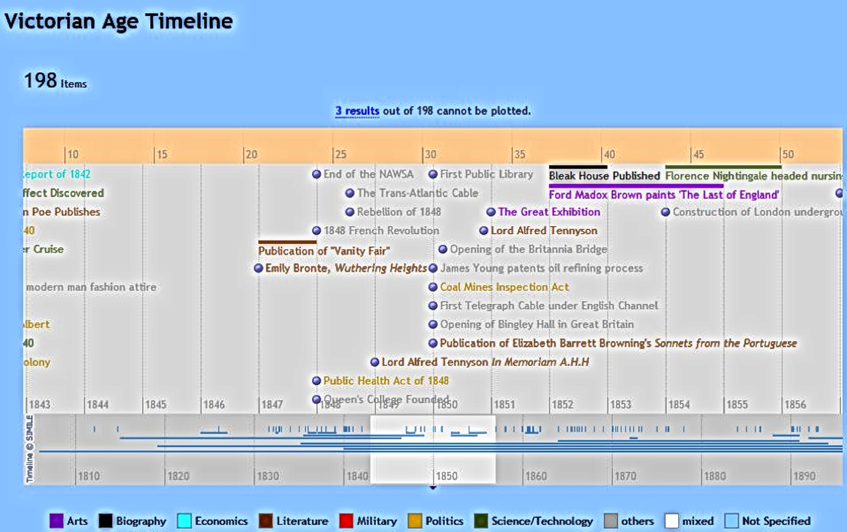
Timelines have long been used[1] to convey chronological information visually, but their potential as teaching tools has expanded with the advent of digital timeline tools. Not only do these tools allow for larger, more detailed, and more interactive timelines, but they also provide mechanisms by which many students can collaborate to create timelines. The screenshot below shows a timeline of the Victorian Age[2] created by students in Jason B. Jones’ English class at Central Connecticut State University.
[1]http://www.cabinetmagazine.org/issues/13/timelines.phphttp://www.cabinetmagazine.org/issues/13/timelines.php
[2] http://www.english.ccsu.edu/jones/timeline/victoriantimeline.html
As part of an assignment,[3] each student was asked to identify 12 historically significant events from a particular year between 1832 and 1901. The students entered information about these events in a shared Google Doc spreadsheet, and data from the spreadsheet were automatically imported into the online timeline. Students could then scroll through the timeline, filter the timeline by event type, search for keywords, and click on events in the timeline for additional information. Brian Croxall, then at Clemson University, later modified the code for this timeline tool to include a Google-powered map[4] of all events on the timeline, which he then used in an American literature survey course (Croxall, 2010).
Jones and Croxall asked their students to contribute to their timelines outside of class, but students could be asked to bring their laptops to class and assemble a timeline synchronously during class. Once a timeline is populated, it becomes a useful analysis tool. For instance, one might ask students to write about patterns they observe in the frequency or categories of events on the timeline or to discuss these patterns in class.
Timelines need not be limited to describing historical events. The plots and character arcs of books and movies can be mapped out on timelines. For instance, the online comic strip “xkcd” mapped the character movements[5] in the Lord of the Rings and Star Wars movies. In a more educational context, Georgetown University sociology professor Sarah Stiles had her students use the online tool Prezi to map the development over time[6] of characters in the book Ain’t No Makin’ It: Aspirations and Attainment in a Low-income Neighborhood by Jay McLeod. This assignment helped her students understand individual characters in the book more deeply, while also helping them see connections among the characters’ lives.
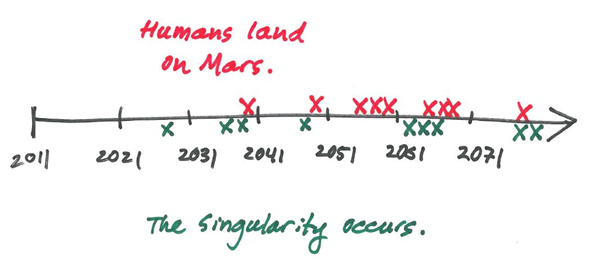
Timelines can be about the future, not just the past. For instance, one might ask students to predict the years that (a) humans land on Mars and (b) the so-called “technological singularity” occurs, and then plot those predictions on a timeline of the future. Below is a sketch of what such a prediction timeline might look like, with X’s corresponding to individual student predictions. Students could be asked to analyze the timeline for patterns and use the timeline as the basis for arguments for or against particular predictions.
[3] http://jbj.pbworks.com/w/page/13151955/VictorianTimeline
[4] http://www.briancroxall.net/timelines/AmericanSurveyTimeline2010.html
[6] https://blogs.commons.georgetown.edu/blog/archives/723
[7] http://briancroxall.net/TimelineTutorial/TimelineTutorial.html
