
 Aziza Ellozy and Hoda Mostafa
Originally published on: February 12, 2008
In our last issue, we introduced concept mapping and mind mapping as learning and assessment tools. We discussed the context in which we decided to use these devices in “Scientific Thinking”, a course designed for freshmen. We highlighted the difference between the two mapping methods, described how they are created, and made suggestions as to how they can be incorporated in your courses. We emphasized that our approach to mapping was a hybrid approach that integrated the powerful visual cues of mind mapping into concept maps.
In this issue, we will concentrate on what we have learned as educators when we used this tool for different types of assignments and assessment exercises.
- Given that our main objective was to have students read the assigned texts before coming to class, we can safely say that this was achieved with the possible added bonus of deeper understanding. In an anonymous end-of-semester survey, 88% of the students in one of the sections (N= 26), agreed or strongly agreed that doing concept maps “required me to look at the assigned reading in more depth”.
- After an initial pen and pencil introduction, most of our students learned how to use the free online “Mindomo” software quite easily. Although not all students immediately took to concept mapping, most of them ultimately learned to create them proficiently.
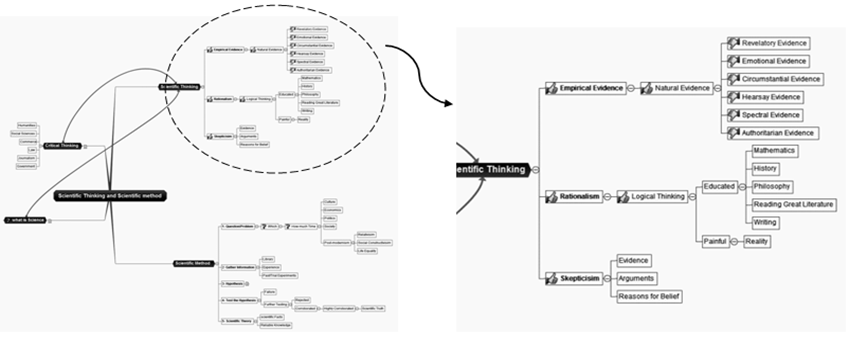
The example below is that of the second Cmap that students had to draw for an assigned reading.
The basic mapping strategy was to have students convert linear text into a non-linear graphic representation. This exercise is especially useful for our freshmen and our entering students who are used to thinking and studying in a linear manner. The method requires them to represent the article as a whole and to visually show relationships between concepts or ideas.
| Section magnified for ease of vision |
In this example, it is evident that the student was able to highlight the four main ideas of the article, to demonstrate the relative importance of the major concepts, and to use the visual cues of thumbs up or down to interpret meaning. Simple relationships were also effectively mapped through connecting arrows. This alone was much more than we could have ever hoped for from an assigned reading that was to be discussed later in class.
- The following are two examples of Cmaps for a lecture presentation by Dr J. Swanson, “Who are the great scientists of all time?” The students were given a rubric which spelled out for them how the quality of analysis and interpretation was to be translated quantitatively to a grade. It is helpful to compare the two.
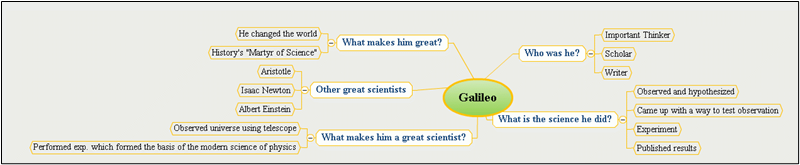
| A. The relative importance of ideas is indicated but is not very distinctive; relationships are not mapped |
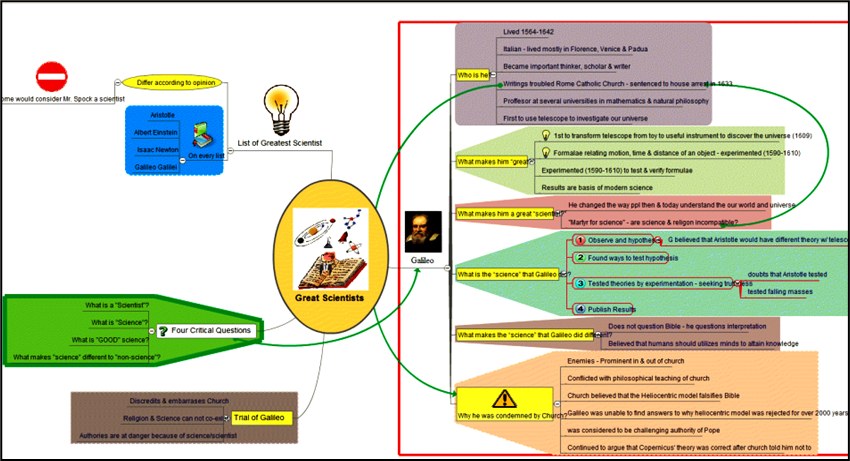
| B. The relative importance of ideas is indicated and simple and complex relationships are very effectively mapped |
Although both are well organized, the difference in details, in organization and in structure is very apparent. In (B) the non-linear structure provides a complete picture of the lecture while in (A) the structure lacks details. In addition, in (B) the student makes very effective use of the visual elements of the mindmapping software (different ideas are grouped according to different colors and shape). Visual symbols add interpretive meaning with economy of space. And this is where the strength of these maps lies: while no two maps can ever be alike, they provide immediate visual data on a student’s understanding or misunderstanding.
- The next example shows two Cmaps of Karl Popper’s article “Heroic Science” (1974). Most of the students complained that the article was difficult and yet, for most of them, their Cmaps revealed otherwise and the in-class discussion was productive. Had they simply been assigned to read it, they would have abandoned it and come unprepared to class to find out the “professor’s” explanation. The following two Cmaps are examples of how easy it is to assess the different analytical skills of students and how one can “read” their interpretation (or misinterpretation) of the article.
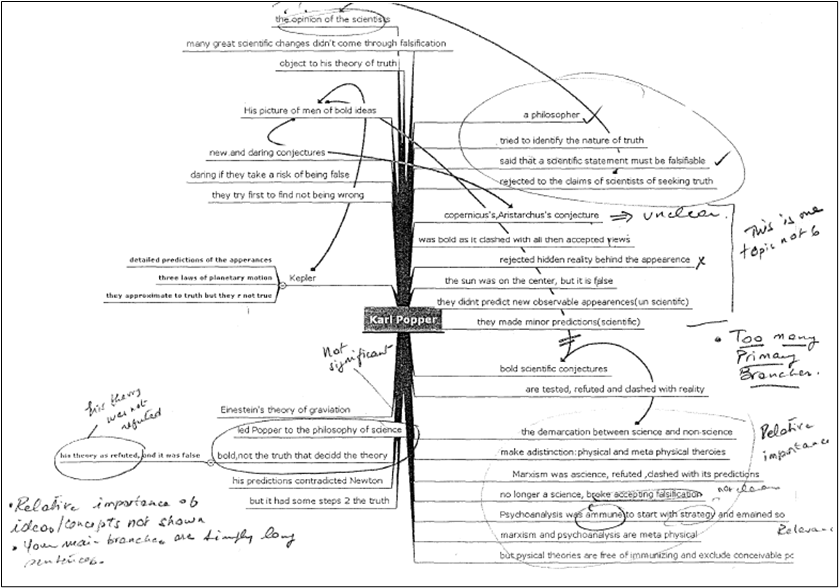
| C. This is an example of a student with poor analytical skills who uses the non-linear structure of the map to weave in a narrative. Linear thinking is forced in the non-linear packaging of the Cmap. The ability to distinguish the relative importance of ideas/concepts is lacking and so is the ability to find correct relationships between the various ideas in the text. Note that there are 32 primary branches and very few secondary branches. |
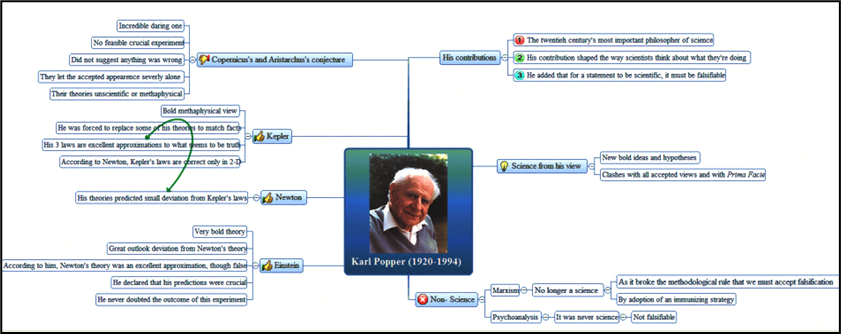
| D. Same article. Student distinguishes significant and relevant ideas very clearly. Visual cues are used effectively and reinforce a correct interpretation of the article |
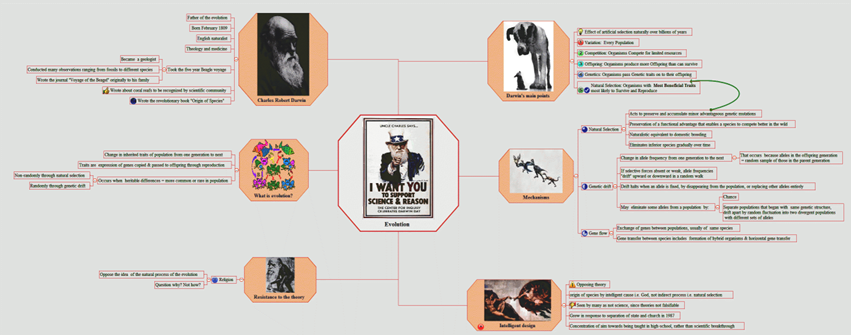
The next two Cmaps illustrate a different type of assignment and/or exam question. (On an exam, they would use pencil and paper). In this approach, students did not have the “scaffolding” afforded by a specific article or lecture. They are asked to draw a Cmap on a broad, open-ended topic which they had discussed in class. Their sources are lectures, articles, and websites. This approach calls upon their synthesis skills and challenged them to give a coherent overall picture of the topic at hand.
| E. Topic: Biological Evolution |
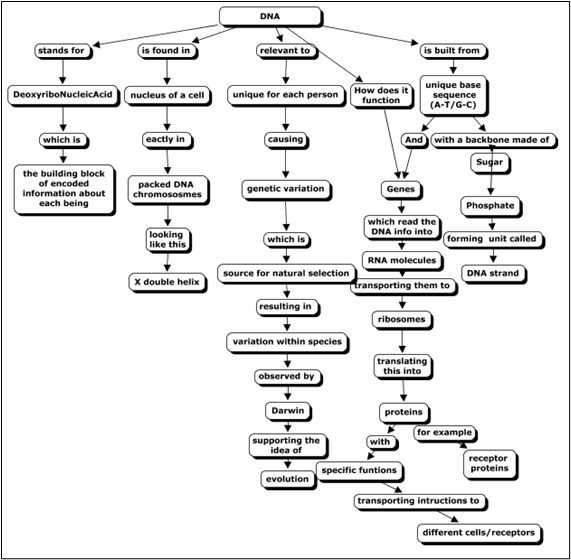
| F. A computerized rendition of a student’s pencil-and-paper Cmap in an in-class exam question. They were asked what he/she knew about the DNA molecule and its connection to broader topics. This type of Cmap is the more traditional way of using them to assess knowledge. |
- It should be noted that, for this tool to be used effectively, it is very important to provide students with a rubric that reflects your expectations and the way in which the Cmap will be graded.
- Finally this type of mapping is fairly time consuming: in an end of the semester survey, in one of the sections, 48% of the students (N=26) said that they took more than an hour to produce the map and 44% said it took them between ½-1 hr.
Summarizing: Concept maps are a window into your students’ minds. They reflect how they dissect information, cluster knowledge under common branches, and recognize links. No two concept maps will be alike. When a student creates a “poor map” with disorganized or multiple irrelevant nodes, instructors can sense areas of weakness or misunderstanding. Basically it gives instructors insight on how their individual students think. They are by no means a unique way of testing or evaluating content or critical thinking but, coupled with written assignments and other active learning approaches and assessment techniques, they can prove to be very effective while addressing students’ different learning styles.
NOTE: If you are interested, be on the lookout for our workshops on C-mapping. This semester’s list of workshops will be sent to you very soon.

Director Center for Learning and Teaching & Professor of Practice at the Center for Learning and Teaching