
Quantitative Reasoning (QR) combines critical thinking with mathematical competence to examine vast amounts of data within a real-world context (Elrod, 2014). Numerous clarion calls to teach these skills merits keen attention in an era of information overload and “big data” (Lutsky, 2009). In consultation with the Center for Learning & Teaching (CLT), I reexamined the “Now You See It” Pathways II course I designed and have been teaching. Results from several Small Group Instructional Diagnoses (SGIDs) reveal that student engagement with QR, using a project-based learning focus, fosters an environment in which the identification of real-world problems enhances a self-directed and student-driven approach to critical inquiry. Such an approach also encourages students to identify existing and potential problems, compose questions, locate and critically interrogate data while learning skills that are transferable across disciplines. To further demonstrate the project-based QR model, this article presents the teaching case study: Geospatial Mapping of Nile River Basin Countries, in which the findings suggest measurable learning outcomes were achieved when assessing student’s understanding of transboundary water rights, water security and water consumption management among the nations who share the Nile River.
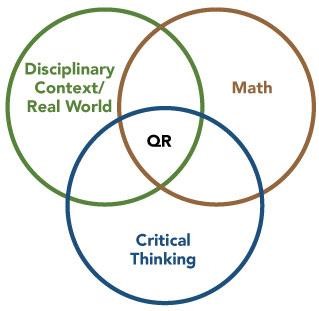
Figure 1. Reprinted with permission from Peer Review, vol. 16, no. 3. Copyright 2014 by the Association of American Colleges and Universities.
Teaching Case Study
The design of the Geospatial Mapping of Nile River Basin Countries assignmentgrew out of current discussions that are attempting to negotiate international transboundary water rights and water security between the 11 African nations: Burundi, Egypt, Eritrea, Ethiopia, Kenya, Rwanda, Sudan, South Sudan, Tanzania, Uganda, and the Democratic Republic of the Congo (Nile Basin Initiative, 2012). Collectively, these countries comprise a population of more than 438 million people (Duncan, 2011). Currently, Egypt and Sudan are defined as “hydro-hegemons” – since they receive the dominant share of water from the Nile in billions of cubic meters (Duncan, 2011). As the construction of The Grand Ethiopian Renaissance Dam (GERD) is underway, Egypt’s dependence on the Nile as its principal form of sustenance, coupled with negligible rainfall, poses major concerns for the country’s sustainable development (Hamada, 2017). Herein lies a project-based learning assignment to help students formulate questions and collect data that may result in viable recommendations that communicate and endorse conflict resolution for equitable access to the Nile River.
Learning Outcomes
This project-based learning assignment enabled students to:
- Compose critical questions designed to actively seek knowledge and gain a deep understanding about the Nile River and the countries who share it.
- Collect, organize, and display relevant data to answer the questions in data visual form (maps).
- Select and use appropriate methods to analyze data collected.
- Identify and evaluate arguments that may contain erroneous reasoning (e.g. unsound mathematical or illogical inferences) and detect the limitations of particular models or misinterpretations of data about the Nile River.
- Draw critical inferences and make future projections using data about the Nile River.
Understand and apply concepts to real-world phenomena to design data visualized maps using Esri Story Map, a geospatial mapping software.
The Assignment in Several Strategic Parts
Part I: Students were placed in 5 teams of 5 and were assigned two countries within the Nile River Basin. They were tasked with researching, in geospatial terms, each nation’s population and natural resources. Most importantly, teams were asked to interrogate how an increase in water access for some nations may help address sustainable development goals. The deliverable from this assignment yielded a collaboratively written, well-researched document consisting of responses to a series of questions for subsequent use to create a data visualized map. A key driver in data visualization is the need to formulate research questions. Without questions, critical inquiry is impeded, and visualizations using data cannot evolve into desired outcomes (Prodromou, 2017).
Part II: Given the assignment’s requirement to design a map, we had a consultation with Dr. Mohie Omar, who is a scientist with the Nile Research Institute, National Water Research Centre (NWRC), in Cairo. He recommended using the following variables to construct a narrative about each Nile River Basin country: (a) water supply (i.e. the amount of rainfall and groundwater each country receives; and (b) water demand (i.e. the amount of water used for agricultural; domestic and industrial uses).
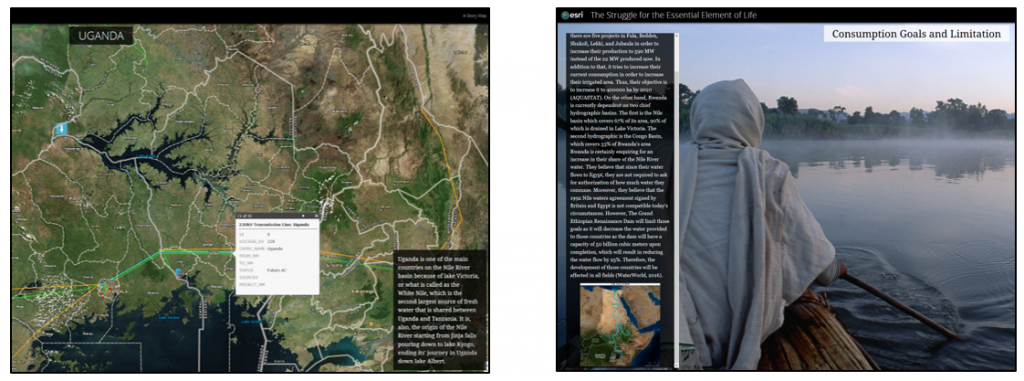
Part III: CLT Senior Officer for Instructional Multimedia, Maha Shawky, trained each team to use the Esri Story Maps geospatial software to design the required data visualized maps.
Part IV: Teams completed their data compilation and the final outcome resulted in the design of a map that plots current and projected water usage within each country. Accordingly, since maps represent some of the most compelling graphic designs, the narratives which unfold garner an informed understanding about the countries that share the Nile River Basin and why a transboundary water rights agreement is urgently needed.
The future challenges the Geospatial Mapping of Nile River Basin Countries assignment will face is long term access to the Esri Story Maps software. Students’ initial engagement with the software was made possible with a 21-day free trial. Subsequent access will require the purchase of a licensing agreement. Sourcing viable and sustainable software for data visualization project-based learning remains part of an ongoing collaborative partnership with CLT. Furthermore, this assignment issues additional calls for reliable open-source mapping software, and consultations with private and government entities to obtain data that promotes quantitative reasoning while also generating real-world learning outcomes.
REFERENCES
Duncan, J. (2011). Redrawing the Map of the World’s International River Basins. New Security. Environmental Change and Security Program, Woodrow Wilson International Center for Scholars. Retrieved from: https://www.newsecuritybeat.org/2011/08/redrawing-the-map-of-the-worlds-international-river-basins/
Elrod, S. (2014). Quantitative Reasoning: The Next “Across the Curriculum Movement. Peer Review, 14, 3. Retrieved from https://www.aacu.org/peerreview/2014/summer/elrod
Hamada, Y.M. (2017). The Grand Ethiopian Renaissance Dam, its Impact on Egyptian Agriculture and the Potential for Alleviating Water Scarcity. Agriculture Research Center, Agricultural Economics Research Institute, Cairo. Springer International Publishing. Retrieved from https://link.springer.com/content/pdf/10.1007%2F978-3-319-54439-7.pdf
Lutsky, N. S. (2008). Arguing with Numbers: Teaching Quantitative Reasoning through Argument and Writing. In B.L. Madison and L.A. Steen (eds.), Calculation vs. Content: Quantitative Literacy and Its Implications for Teacher Education. Washington, D.C.: Mathematical Association of America. Retrieved from https://www.maa.org/sites/default/files/pdf/QL/cvc/cvc-059-074.pdf
Nile Basin Initiative (2012). State of the River Nile Basin 2012. Myriad Edition, Brighton, UK. Retrieved from: http://sob.nilebasin.org/index.php
Prodromou, T. (2017). Data Visualization and Statistical Literacy for Open and Big Data. IGI Global. Hershey, PA.